Associated with
4 min read
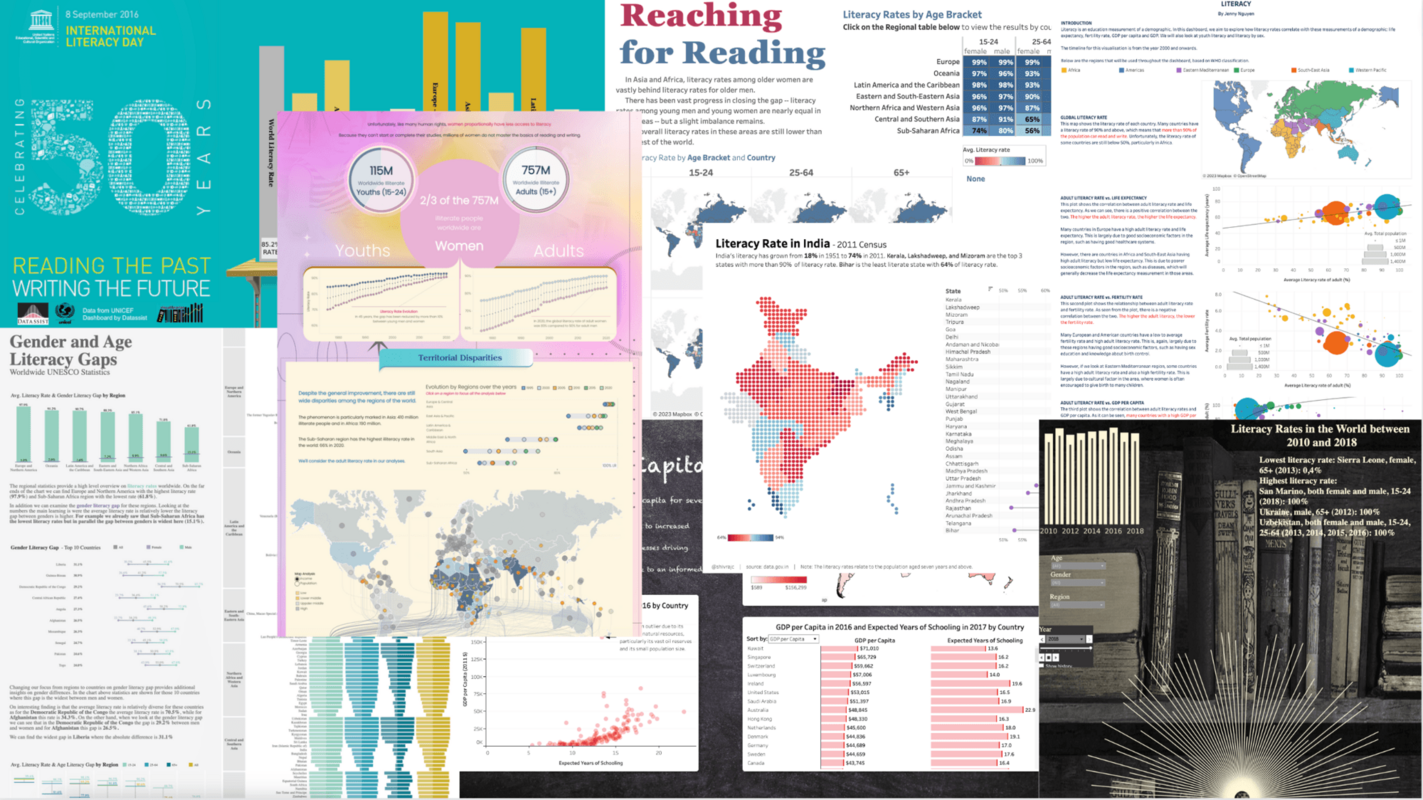
27 Data Visualizations to Gain Insight into Global Literacy
Learn about the complexities and nuances of literacy rates around the world through this gallery of visualizations created in Tableau Public.
More Ways to Read:
🧃
Summarize
--
The key takeaways that can be read in under a minute
Sign up to unlock

Worth the squeeze
Get access to the condensed version of this piece, and every other article on The Juice by AudiencePlus, and so much more.
Start a free account on The Juice and we'll send you weekly emails sharing which podcasts, blogs, guides,
etc. are trending with other marketing or sales pros. We call it the Top 5!
Other content from
Narrative Science


Featured by AudiencePlus
 and Lessons Learned")