Associated with
Concert venue ticket pricing analytics - Part 2: using an image as a map
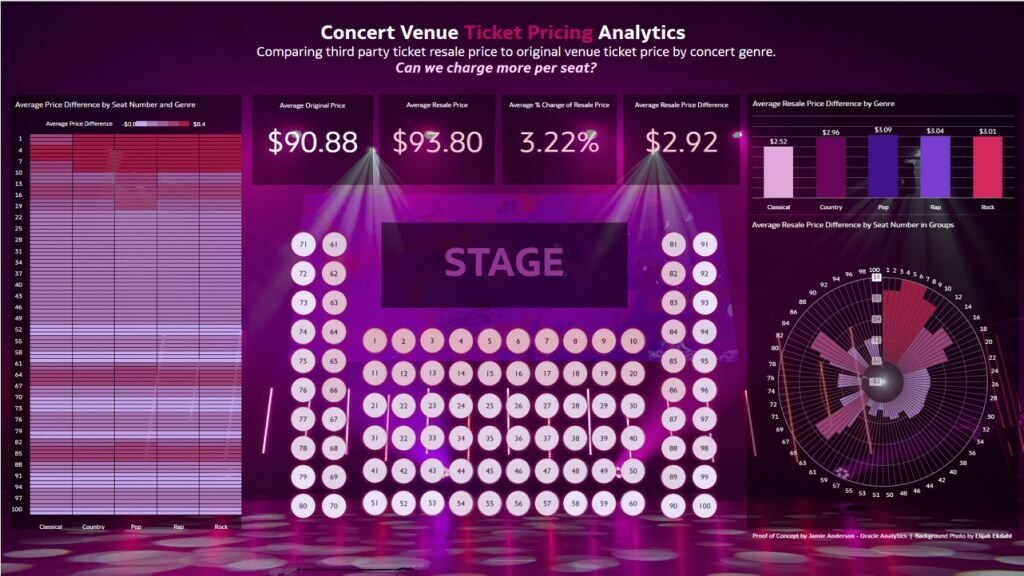
In Part 2 of this series, learn how to upload an image to serve as a "map" to enhance the analysis of understanding which seats are resold at a higher price. Check out Part 1 to learn how a grid heat map, bar, and radar bar visualization can aid in analyzing patterns within the data, and Part 3 (upcoming) to learn how to use tiles, text boxes, visualization and canvas formatting, and visualization filtering to guide the dashboard consumer in their analysis.
More Ways to Read:
🧃
Summarize
--
The key takeaways that can be read in under a minute
Sign up to unlock

Worth the squeeze
Get access to the condensed version of this piece, and every other article on The Juice by AudiencePlus, and so much more.
Start a free account on The Juice and we'll send you weekly emails sharing which podcasts, blogs, guides,
etc. are trending with other marketing or sales pros. We call it the Top 5!
Other content from
Oracle


Featured by Salesforce
